Getting Started With ELK, Filebeat With Spring Boot log in Windows Part 1
I wrote this article because I found that it’s quite hard to find a starter guide for someone to use ELK and integrate it with their Spring Boot log file especially in Windows OS (Yes I’m not very practical here to host it in Windows but I can’t run from my company current infra I guess). It’s not necessarily Spring Boot logfile, but yeah to find article related to this topic with a much simpler and quick guide one is very difficult based on my experience. In this guide I’m using ELK stack including Filebeat in my Windows 11 machine to fetch my Spring Boot log file and display it on the web. So let’s just deep dive into it.
Prerequisites
- Download ELK stack First thing first you need to have all three ELK stack (Elastic Search, Logstash, Kibana) installed in your machine. You can download all of it below and extract the compressed file.
-
Download Filebeat https://www.elastic.co/downloads/beats/filebeat
- Existing Spring Boot Project with logfile configured If you don’t have any Spring Boot project or any logfile configured, you can just download any sample logfile(not necessarily Spring Boot since we only need a structured logfile) online. As for example, you can refer my logback.xml file that will be used to integrate with ELK.
Configuring ElasticSearch
To start Elasticsearch on Windows, navigate to the bin folder and run:
elasticsearch.bat
It may take a few minutes, depending on your system. On the first run, the logs will display a default password for logging into Kibana. If you missed it, reset the password using:
elasticsearch-reset-password -u elastic
You’ll need this password later for Kibana and Logstash configurations.
Configuring Logstash
Ok now for Logstash part, few configurations need to be taken care of before you run it.
-
Go to the config folder in the Logstash directory.
-
Locate the .conf file (e.g., logstash-sample.conf).
-
Configure it to create an index and connect to Elasticsearch. Here’s an example config: https://gist.github.com/syamil24/60ea5061f22230d2a62c72d2c8b6e1c4
-
Replace the
hostsIP and password with the credentials from your Elasticsearch setup.
1
2
3
4
5
6
7
8
9
10
11
12
13
14
15
input {
    beats {
    port => 5044
    }
}

output{
    elasticsearch {
    hosts => ["https://localhost:9200"]
    index => "filebeat-demo-%{+YYYY.MM.DD}"
    user => "elastic"
    password => "=MMadZCXVGJ+a1Cd32Ub"
    ssl_certificate_verification => false
    }
}
Index is a very importation thing in Elasticsearch. Based on its official website, An Elasticsearch index is a logical namespace that holds a collection of documents, where each document is a collection of fields. For our case, this log file will be put into and index called filebeat-demo-%{+YYYY.MM.DD} as per the Logstash config above, meaning to say that new index will be created daily for every log that we fetched on every day.
To run Logstash in cmd, go to bin folder and execute command logstash.bat -f config/logstash-sample.conf. Just wait for a few seconds and Logstash will be successfully run.
Configuring Kibana
Configuring Kibana for starter is just a direct process.
- Open
kibana.ymlinside the config folder. -
At the end of the file, there will be one entry for elasticsearch.hosts

- Locate elasticsearch.hosts and ensure it points to your elasticsearch ip and port (yes it will be localhost by default): [‘https://localhost:9200’].
- Simply go to bin folder and run
kibana.bat - Kibana might take around 5 minutes to fully start—your mileage may vary.
- You can view in web with URL http://localhost:5601.
Configuring Spring Boot logback.xml
Now that ELK is running, let’s configure Filebeat to work with Logstash and process Spring Boot logs.
Below is my Spring Boot logback.xml file. I simplified what is the configuration about as below:
- The log file will be named as test-service.log
- Every day the log will be compressed to .gz file and named as test-service.DATE.log.gz, and existing content in test-service.log file will be deleted daily.
- Pattern tag and file tag content is what we are going to map with our Filebeat configuration.
1
2
3
4
5
6
7
8
9
10
11
12
13
14
15
16
17
18
19
20
21
22
23
24
25
26
27
28
29
<?xml version="1.0" encoding="UTF-8"?>

<configuration>
    <appender name="ROLLING-LOG"
              class="ch.qos.logback.core.rolling.RollingFileAppender">
        <file>test-service.log</file>
        <rollingPolicy class="ch.qos.logback.core.rolling.TimeBasedRollingPolicy">
            <fileNamePattern>test-service.%d{yyyy-MM-dd}.log.gz
            </fileNamePattern>
            <!-- keep 1 days' worth of history -->
            <maxHistory>100</maxHistory>
        </rollingPolicy>
        <encoder class="ch.qos.logback.classic.encoder.PatternLayoutEncoder">
            <Pattern>%d %-5level [%thread] [TRACE-ID=%X{trace-id:-}] %logger{0}: %msg%n</Pattern>
        </encoder>
    </appender>
    <appender name="CONSOLE" class="ch.qos.logback.core.ConsoleAppender">
        <encoder>
            <charset>UTF-8</charset>
            <Pattern>%d %-5level [%thread] [TRACE-ID=%X{trace-id:-}] %logger{0}: %msg%n</Pattern>
        </encoder>
    </appender>

    <root level="INFO">
        <appender-ref ref="ROLLING-LOG" />
        <appender-ref ref="CONSOLE" />
    </root>
</configuration>
Configuring Filebeat
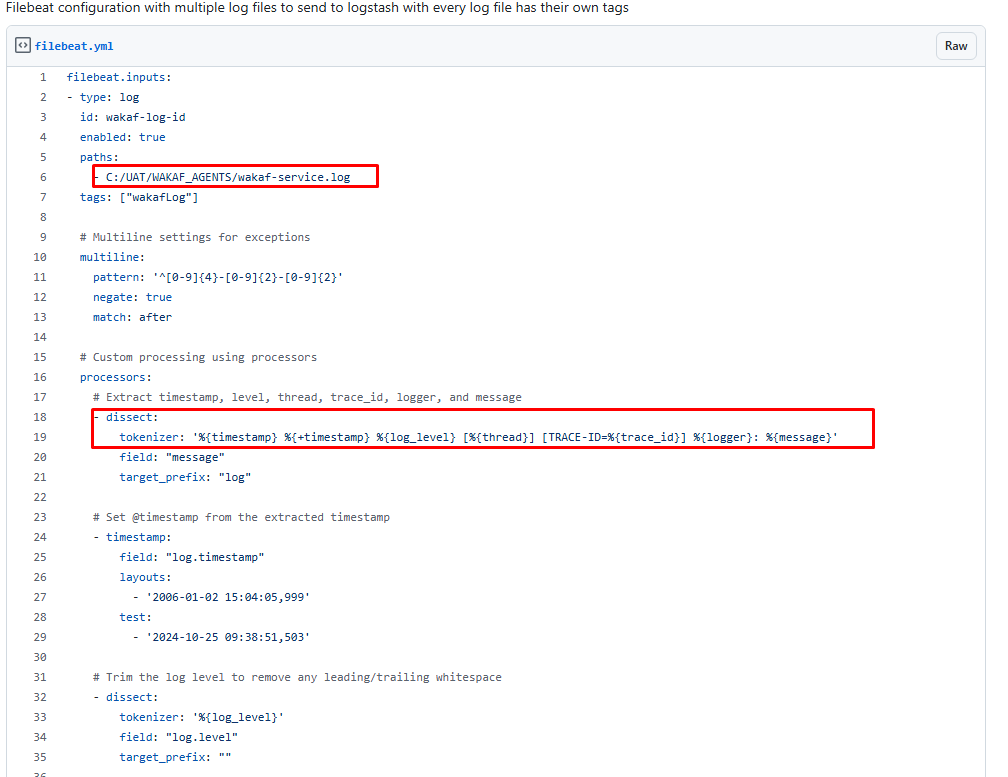
I had created a gists here for Filebeat configuration.: https://gist.github.com/syamil24/2a0b06251d33e4cb87d7bf7a2d56d614 You can refer below on what are the things need to changed. If your log file format is different than my logback.xml configuration, then you can modify the tokenizer field and change accordingly. You can refer below pic on what content need to change accordingly especially on your log file paths.
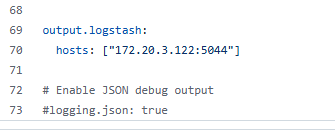
Update the Logstash IP as well. If running locally, use:
Viewing Logs in your Kibana
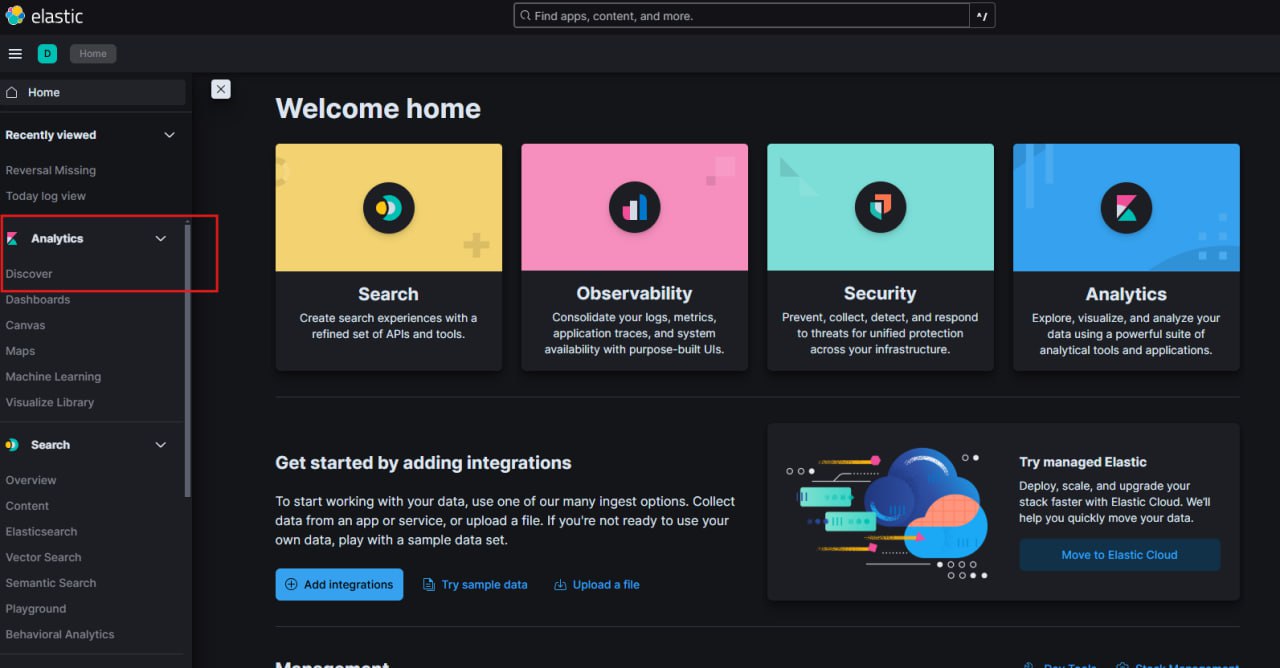
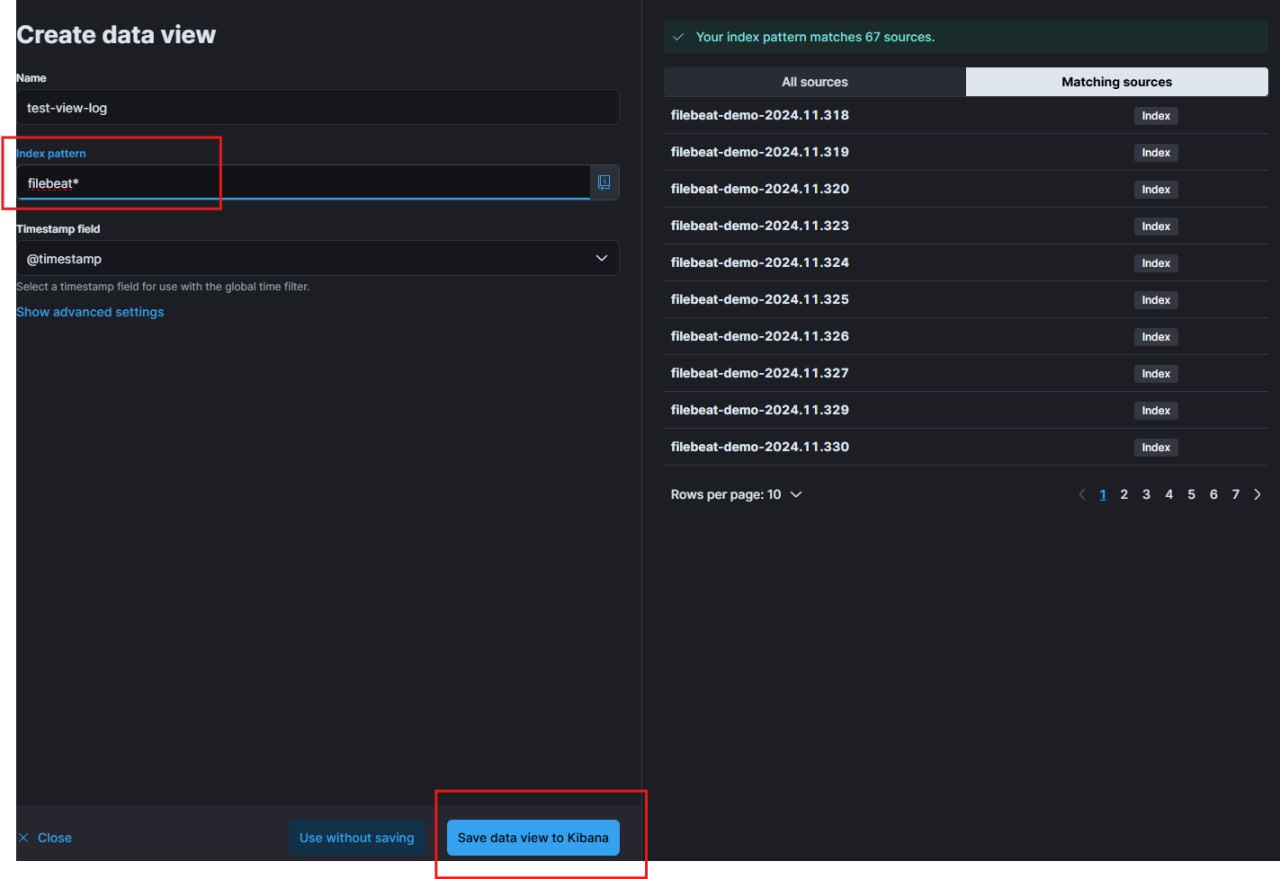
Now we are on the final section of the first part of this tutorial. Let’s log in to Kibana with the default username elastic and the password given as mentioned previously. To view the logs, go to discover tab and create a new data view as my picture below.
-
Go to Discover Section
-
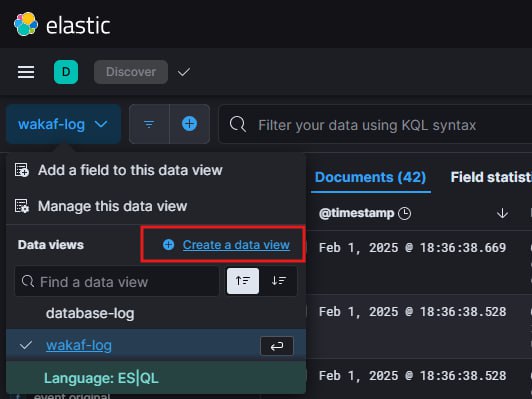
Create a Data View
-
Remember that we declare our index as filebeat-demo earlier? Here we aren’t going to fully declare the index, just type filebeat-demo* so that this data view will display as well past log files, not only the current or specific date of index.
Summary
Congrats you’ve managed setting up your own ELK stack with Filebeat for monitoring purposes. This is just a basic setup in order to test if everything is working fine on your infra, there’s a lot more work to be done such as: - Configure SSL for security. - Scale to multiple nodes if needed. - Aggregate logs from multiple microservices into ELK.
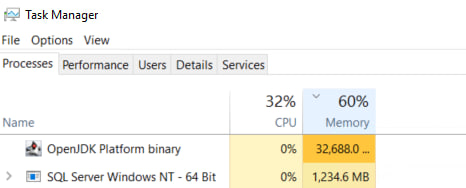
Oh yes just be remindful that by default Elasticsearch will use up to 32GB of your memory, hence make sure you have plenty of resources in order to scale. You can change this later at config/jvm.options
Indeed it is consuming your 32GB of memory…
Stay tuned for Part 2, where I’ll show how to handle multiple log files with different indexes—useful for microservices application.
Thanks for reading really appreciate it 🚀 !!