Getting Started With ELK, Filebeat With Spring Boot log in Windows Part 2
This post is a continues post from the Part 1 of “Getting Started With ELK, Filebeat With Spring Boot log in Windows” post. If you’ve already read and tried out Part 1, it’s now time to scale up and manage multiple log files — all with a single ELK stack instance. Don’t worry — this post won’t take you more than 4 minutes to read. Let’s dive in.
The Power of Tags
One of the simplest and most powerful features in Logstash is tags. They’re key to collecting multiple log files and sending them properly into Elasticsearch.
Here’s the approach:
-
Tag Your Log Files in Filebeat
You’ll need to configure Filebeat to:
- Read different log files
- Assign each log file a specific tag
Your configuration will look similar to Part 1, with just a few additions. In my case, I’ve assigned the tags javaLog and databaseLog to two different log sources, because their formats differ.
1
2
3
4
5
6
7
8
9
10
11
12
13
14
15
16
17
18
19
20
21
22
23
24
25
26
27
28
29
30
31
32
33
34
35
36
37
38
39
40
41
42
43
44
45
46
47
48
49
50
51
52
53
54
55
56
57
58
59
60
61
62
63
64
65
66
67
filebeat.inputs:
- type: log
  id: java-log-id
  enabled: true
  paths:
    - C:/UAT/JAVA_APP/app-service.log
  tags: ["javaLog"]

  # Multiline settings for exceptions
  multiline:
    pattern: '^[0-9]{4}-[0-9]{2}-[0-9]{2}'
    negate: true
    match: after

  # Custom processing using processors
  processors:
    # Extract timestamp, level, thread, trace_id, logger, and message
    - dissect:
        tokenizer: '%{timestamp} %{+timestamp} %{log_level} [%{thread}] [TRACE-ID=%{trace_id}] %{logger}: %{message}'
        field: "message"
        target_prefix: "log"

    # Set @timestamp from the extracted timestamp
    - timestamp:
        field: "log.timestamp"
        layouts:
          - '2006-01-02 15:04:05,999'
        test:
          - '2024-10-25 09:38:51,503'

    # Trim the log level to remove any leading/trailing whitespace
    - dissect:
        tokenizer: '%{log_level}'
        field: "log.level"
        target_prefix: ""

- type: log
  id: database-log
  enabled: true
  paths:
    - C:/UAT/DV_SERVICE/database.log
  tags: ["databaseLog"]

  processors:
    # Parse the log message using dissect
    - dissect:
        tokenizer: "%{log_timestamp} | %{execution_time} | %{category} | %{sql_query}"
        field: "message"
        target_prefix: "parsed"

      # Convert log_timestamp to @timestamp
    - timestamp:
        field: "parsed.log_timestamp"
        layouts:
        - "2006-01-02 15:04:05.0000"

      # Add additional fields for structured logs
    - add_fields:
        target: ""
        fields:
          execution_time: ""
          category: ""
          sql_query: ""

    # Optionally, drop the original "message" field if no longer needed
    - drop_fields:
        fields: ["message"]
- Define Tags in Logstash
Once the tags are added, you can configure Logstash to:
- Identify logs by their tags
- Send each tagged log to a specific index in Elasticsearch
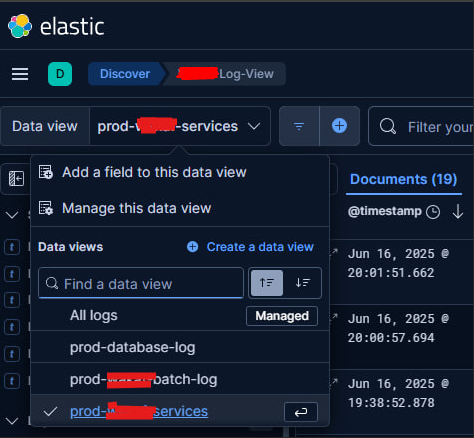
This way, when you open Kibana, you can easily search and filter by index to separate application logs, databaseLog, javaLog etc.
1
2
3
4
5
6
7
8
9
10
11
12
13
14
15
16
17
18
19
20
21
22
23
24
25
26
input {
    beats {
    port => 5044
    }
}

output{
    if "databaseLog" in [tags] {
        elasticsearch {
        hosts => ["https://localhost:9200"]
        index => "database-log-%{+YYYY.MM.DD}"
        user => "elasticUser"
        password => "ELK_PASSWORD=1"
        ssl_certificate_verification => false
        }
    }
    else if "javaLog" in [tags] {
        elasticsearch {
        hosts => ["https://localhost:9200"]
        index => "filebeat-demo-%{+YYYY.MM.DD}"
        user => "elasticUser"
        password => "ELK_PASSWORD"
        ssl_certificate_verification => false
        }
    }
}
As you can see in my picture below I can view multiple log applications in Kibana with that configuration.
You may refer my gists below for full configuration:
- https://gist.github.com/syamil24/2a0b06251d33e4cb87d7bf7a2d56d614
- https://gist.github.com/syamil24/60ea5061f22230d2a62c72d2c8b6e1c4
Takeaways
Instead of using tags, there’s a lot of other methods to segregate your multiple log files in one single Logstash instance such as fields.app_name or fields.log_type in your filebeat entry. I tried to make it works using fields approach but seems it didn’t goes well with me and using tags directly working our for me on the first try. The Elastic docs and forums are very useful for your references if you want to scale up more of your microservices application. Happy scripting then!!